Connecting and Using the Naviq Utility
The MTS160 is supported by the Naviq Utility, which provides tools for configuration, monitoring, logging, and firmware updates. It can be used to:
- Configure the sensor operating mode
- View magnetic field strength in real time
- Monitor track position, angle, and marker detection
- Capture and review data logs
- Update the sensor firmware
Web-Based Utility
The MTS160 utility is a web-based program that users access through a web browser, offering several key benefits:
No Installation Required: Users do not need to download or install any software, simplifying the process and reducing potential software conflicts.
Platform and Hardware Independence: The MTS160 utility operates through a web browser, making it compatible with any operating system, such as Windows, macOS, Linux, and others. It is also hardware-independent, meaning it can run on various devices, including PCs, Macs, Linux machines, smartphones, and tablets, as long as they have a USB port for connecting to the sensor. This broad compatibility eliminates the need for multiple versions of the software and ensures all users have a consistent experience.
Automatic Updates: Updates are applied directly on the Naviq server, so users always have access to the latest version without needing to manually update their software.
Connecting the Sensor and Launching the Utility
To launch the utility simply connect the sensor to the PC via the USB port, with or without power on the main M8 connector. If unconnected to a power supply, the sensor will take power from the PC and turn on.
The PC will establish the USB communication and a small pop up window will appear at the bottom right of the screen.
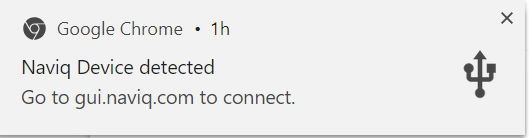
Clicking on that window will open a browser with the Naviq Utility.
The GUI is composed of a header menu and a footer that remain displayed at all times. The key components are:
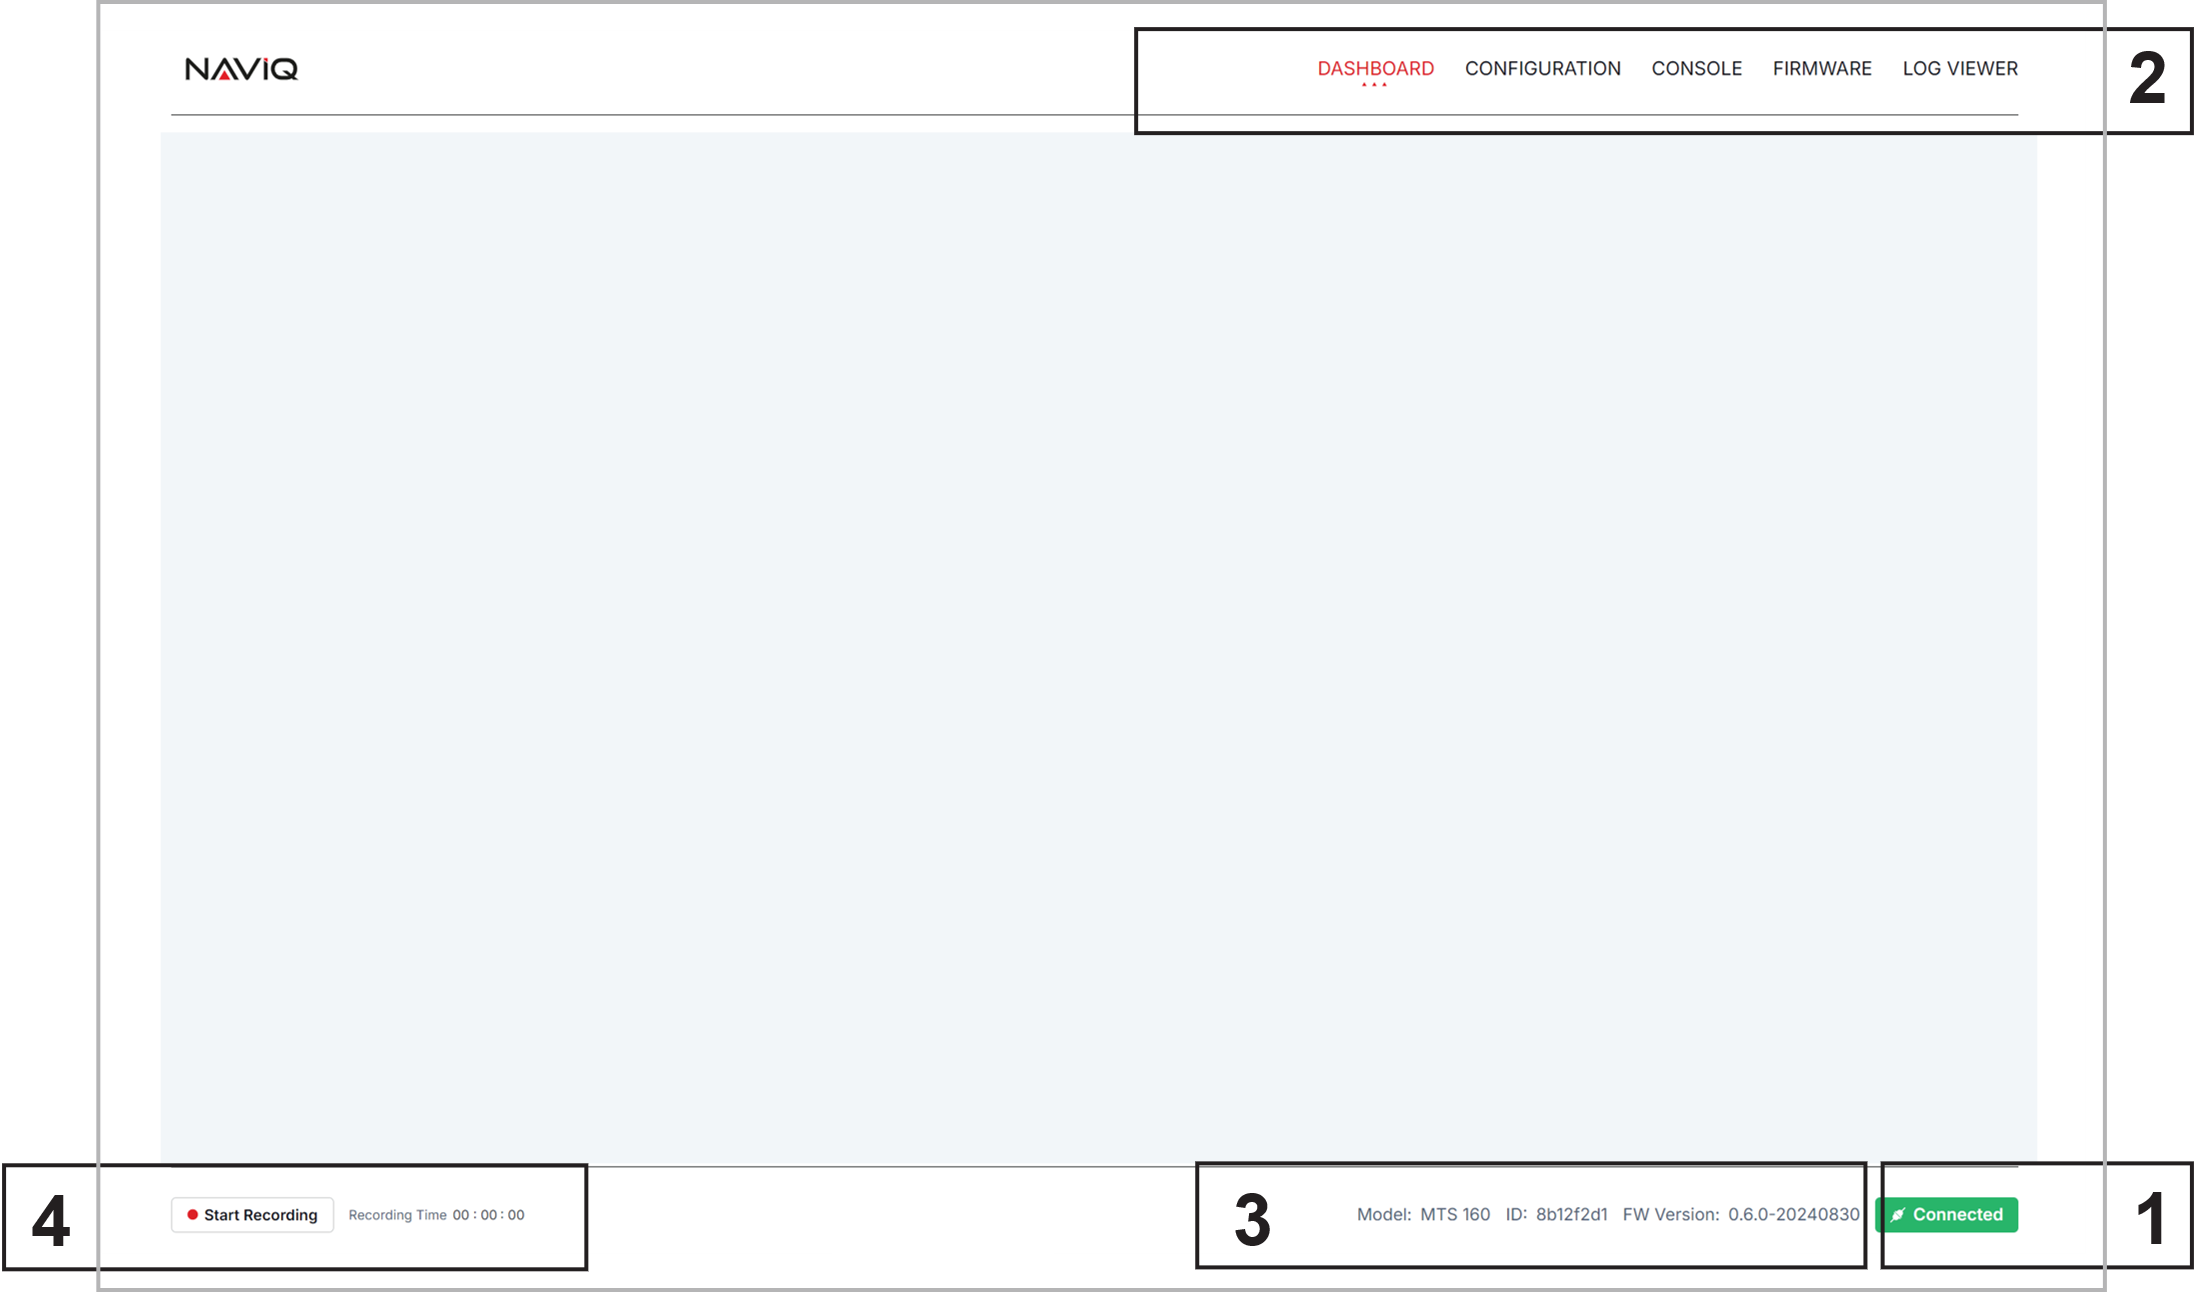
- Connection status. If the sensor is attached to USB and the flag shows disconnected, click on it to select the sensor and pair it
- Main Menu
- The sensor hardware and firmware identification
- Data Logging Control
Dashboard
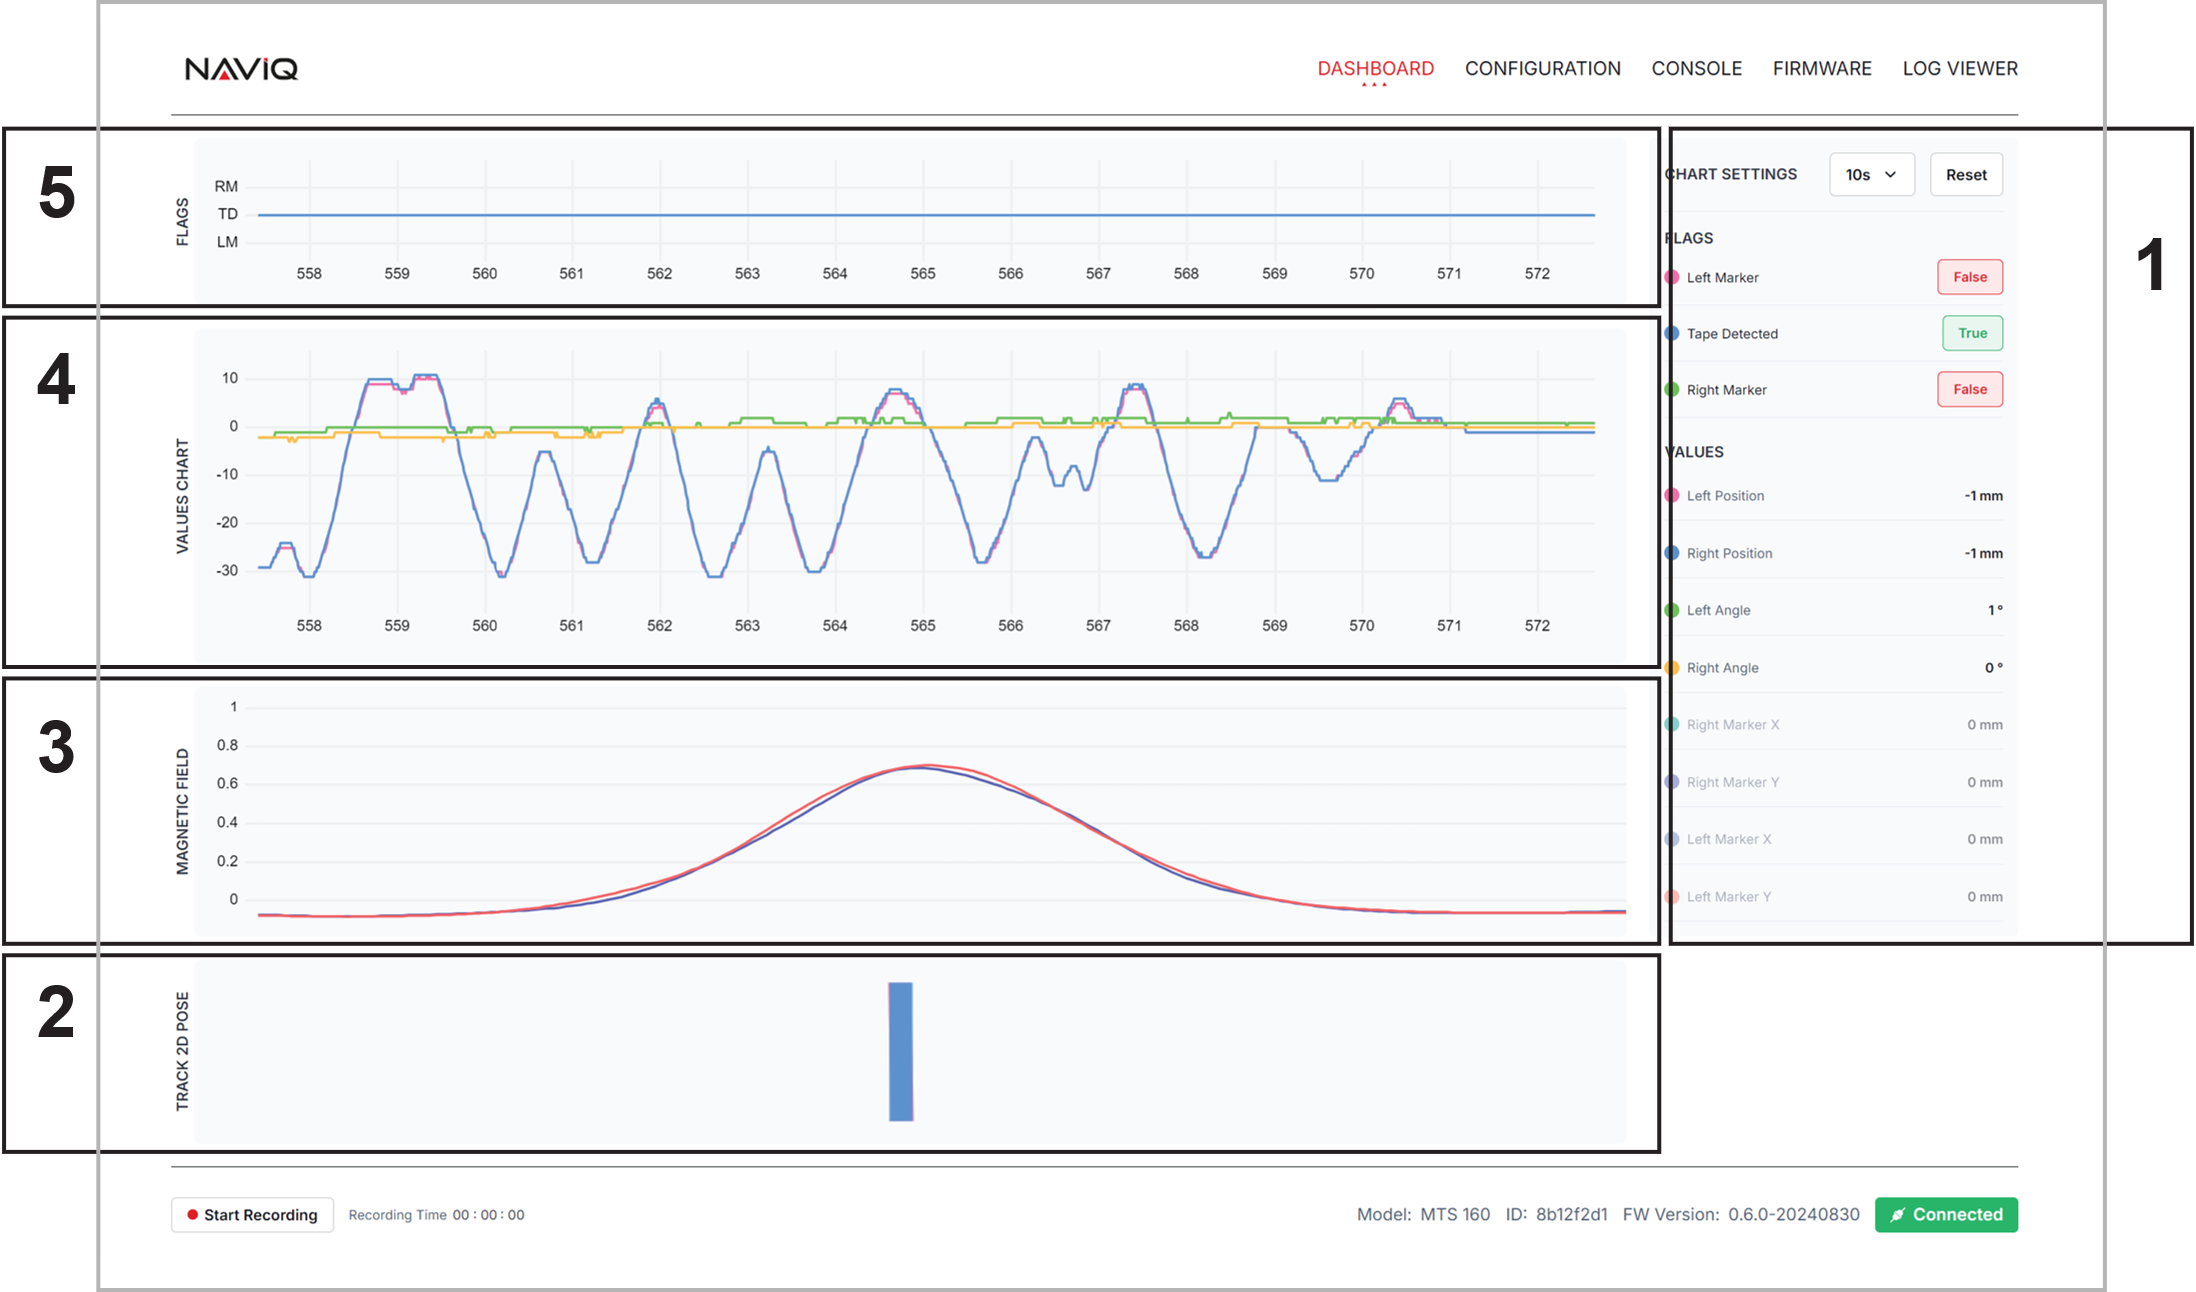
The dashboard is where the sensor information can be visualized. The screen is composed of 5 sections:
- Numeric Views and Chart Controls. Clicking on any item will show or hide it from the plot windows.
- Visualization of the relative position and angle of each of the two tracks.
- Magnetic field visualization
- Scroll chart for plotting any of the sensor's captured values.
- Track and Markers Presence Scroll chart
Configuration
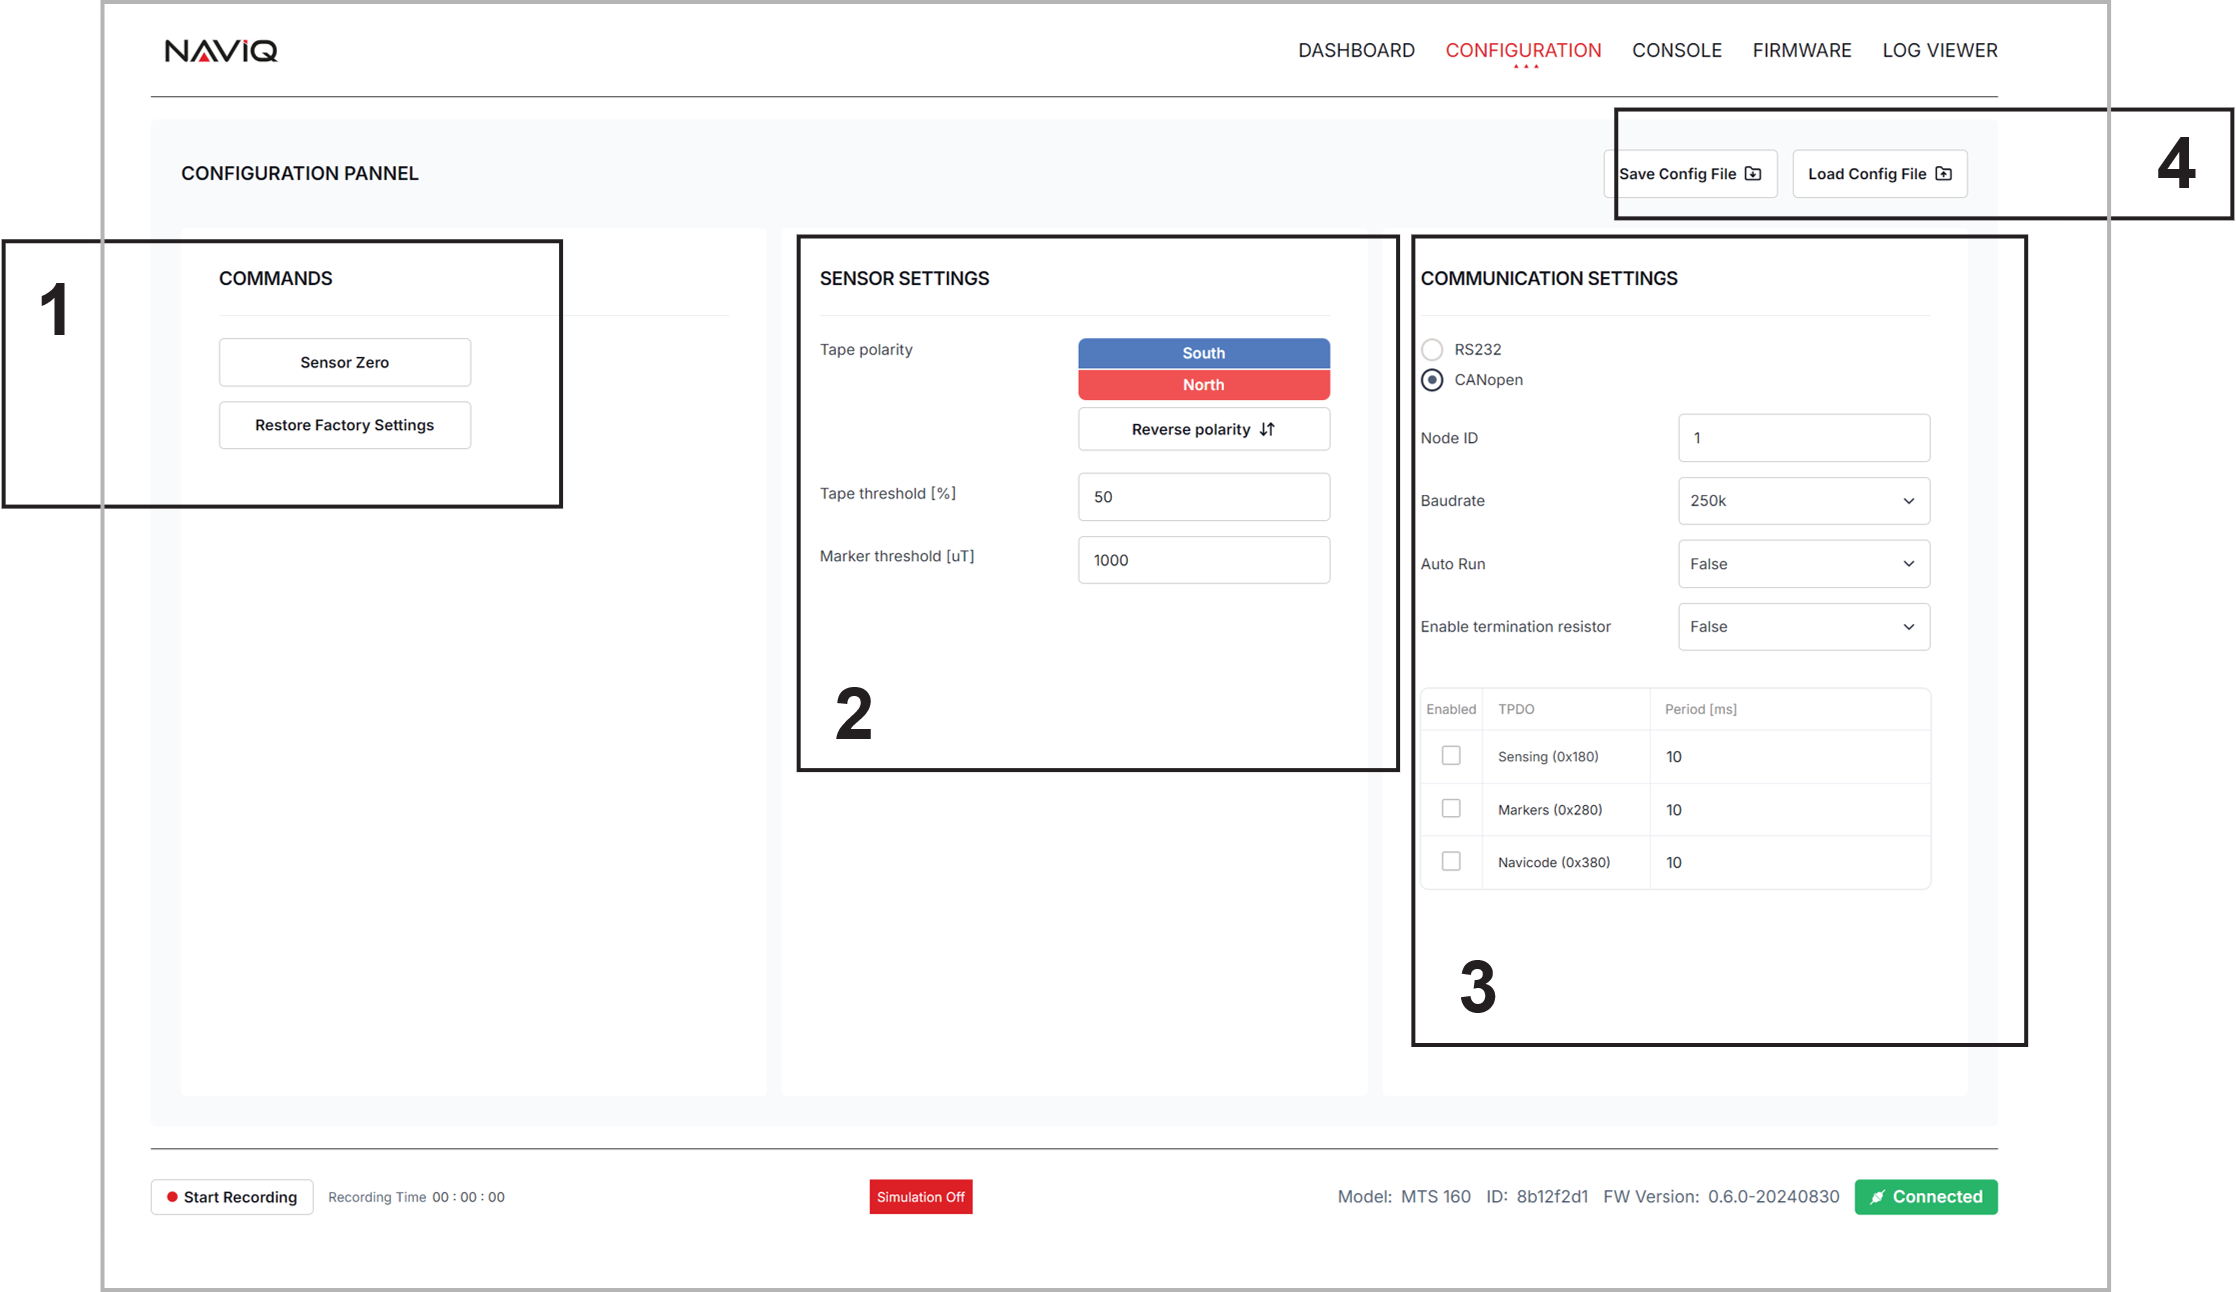
The configuration screen is composed of four sections:
- Commands buttons for calibrating the ambient zero-level reference and for resetting the sensor's factory default configuration.
- Setting parameters relating to the track and marker detection
- Selecting and setting the communication protocol
- Saving and restoring configurations to/from disk. This functionality is useful when multiple sensors need to be prepared with the same configuration during production.
Configuration changes sent to the sensor update the active runtime settings. Save the active configuration to the sensor if the settings should remain after power cycling. Disk save/restore is separate from the sensor's nonvolatile memory.
Console
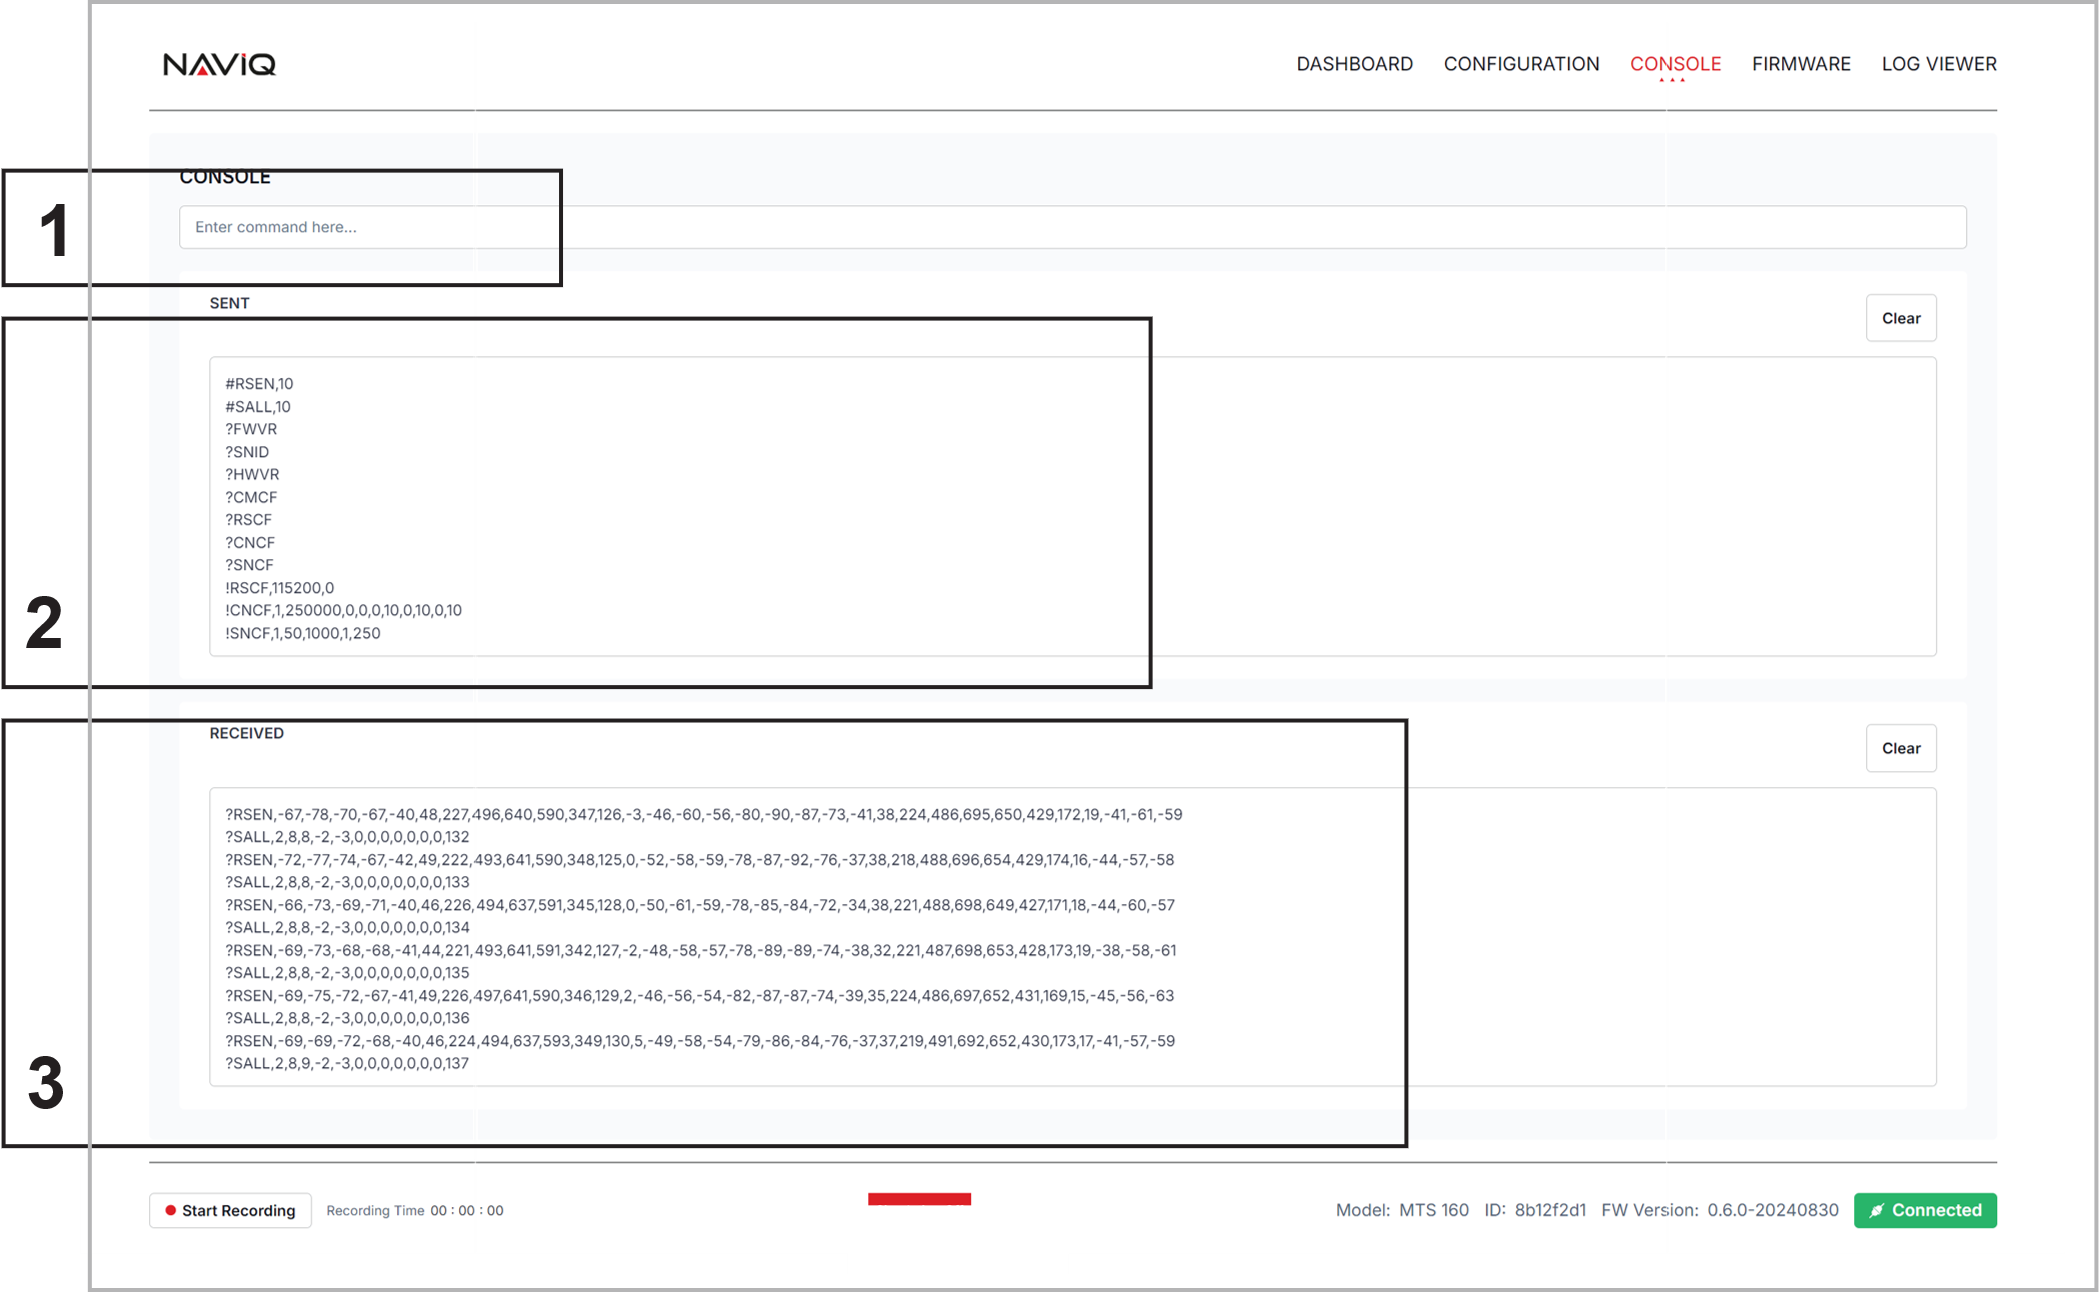
The console is intended primarily as a development and integration aid. Normal operation does not require it, since sensor data and configuration settings can be viewed and changed more efficiently through the GUI.
It is provided as a development aid for manually exercising the serial commands described in this manual, particularly when integrating a navigation computer. The console simplifies the process of sending raw commands and displaying the sensor's response. It consists of three elements:
- User entry field
- History of commands sent to the sensor, including those sent by the GUI as a result of user selections
- Responses from the sensor
Firmware Update
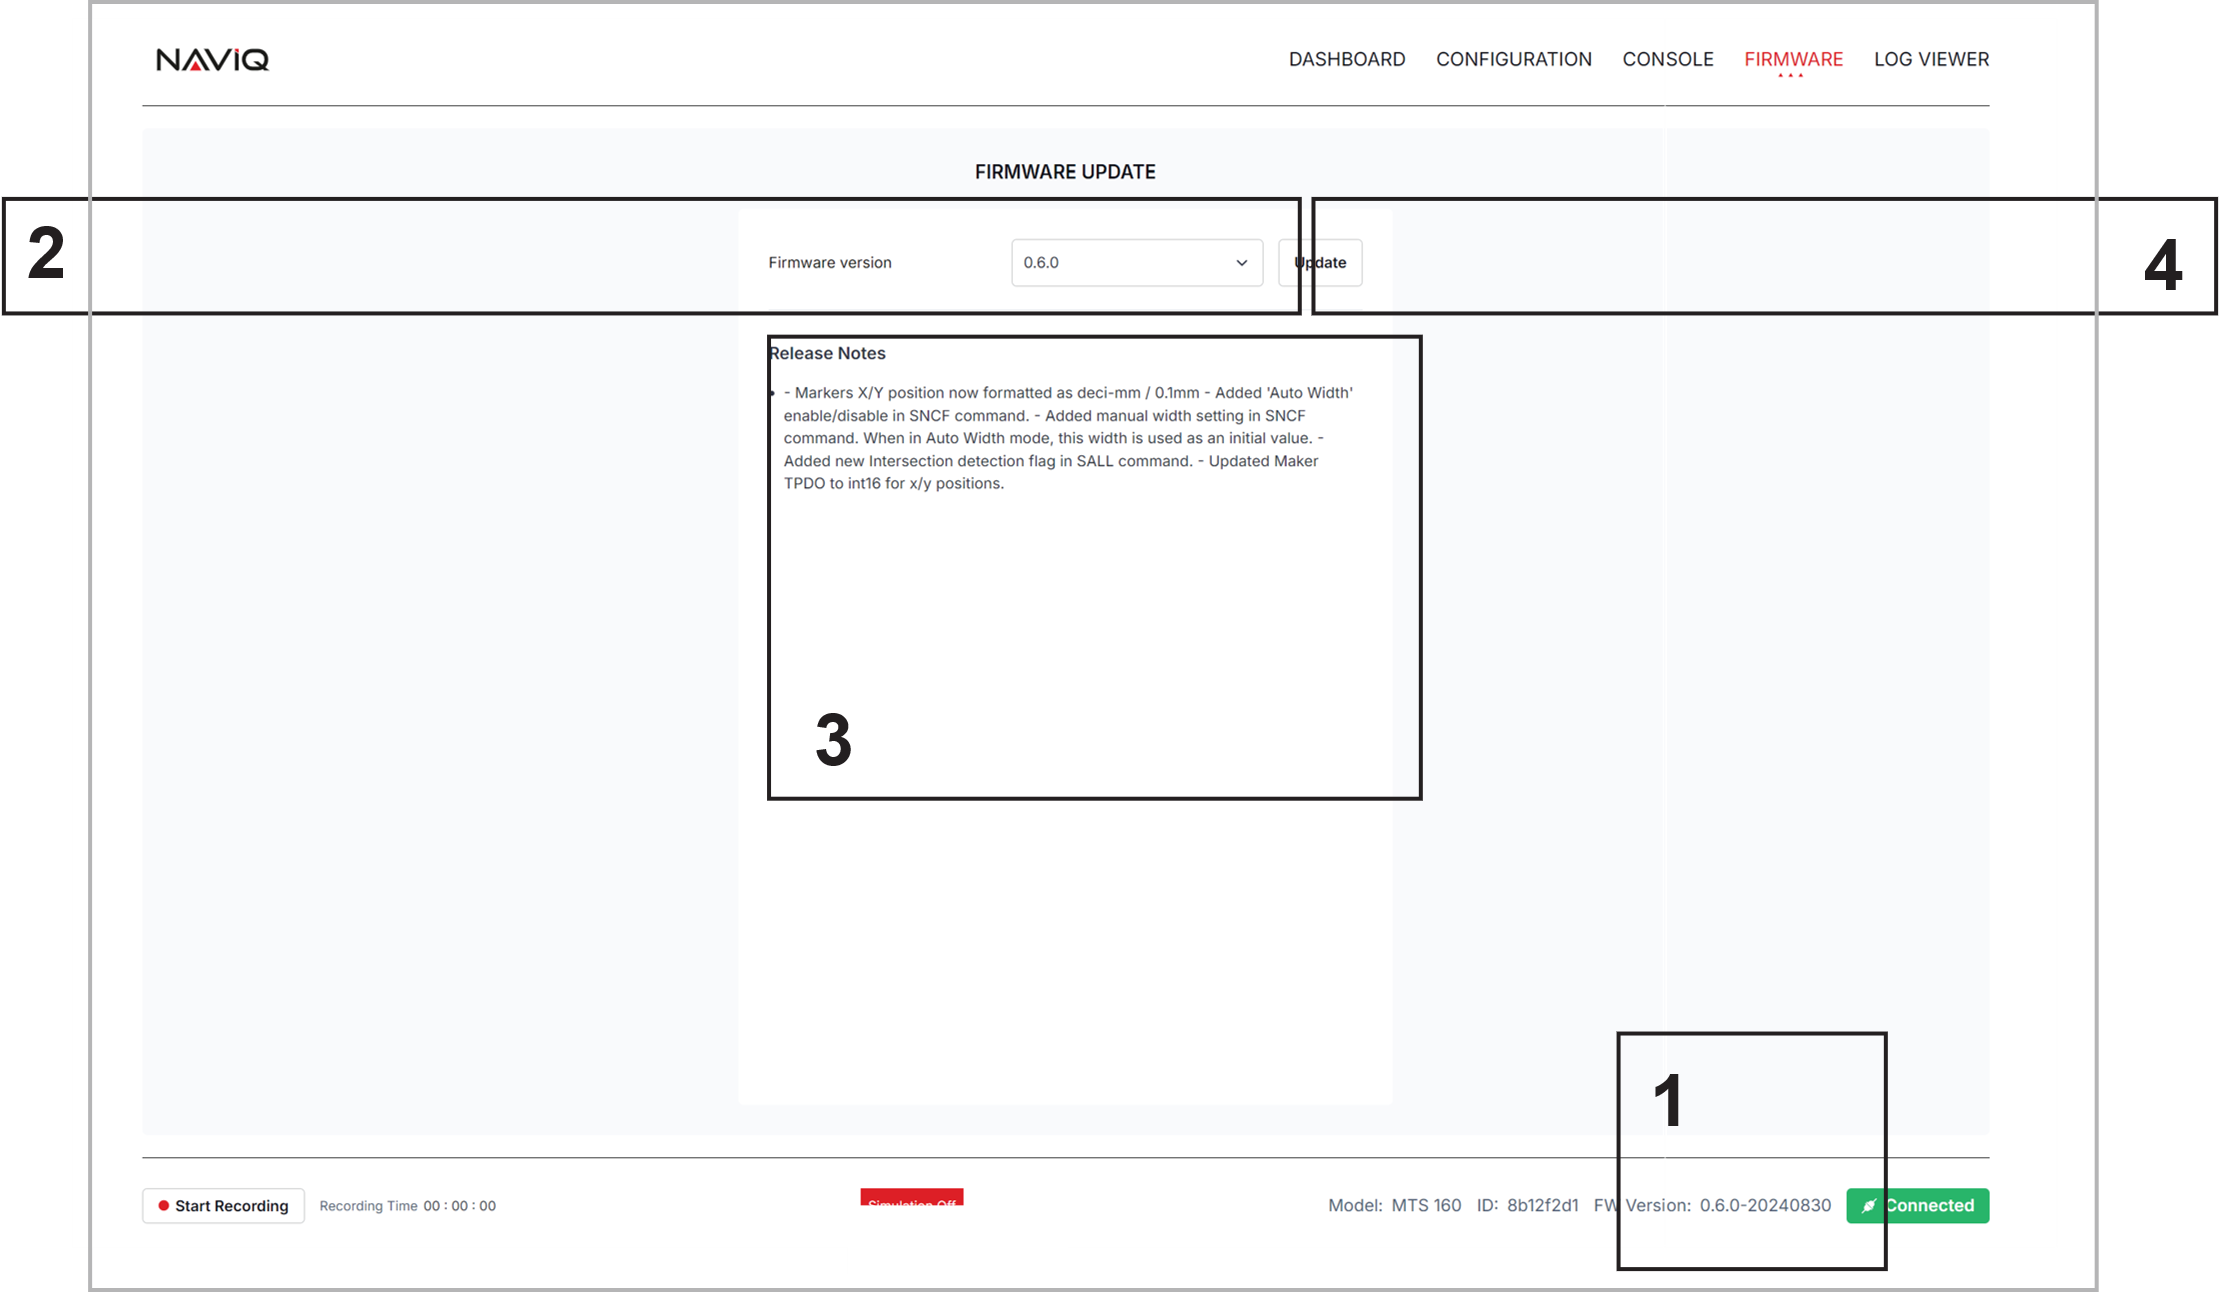
The firmware page is used to update the sensor firmware. It is good practice to check for newer firmware whenever the sensor is connected to the utility. The window contains the following elements:
- Currently installed firmware revision, shown in the footer on all GUI pages
- Firmware selection menu, which retrieves available firmware versions from the Naviq server and lists the newest version first
- Release Notes, which display the changes included in the selected version
- Update button, which starts the firmware update process
Data Logging
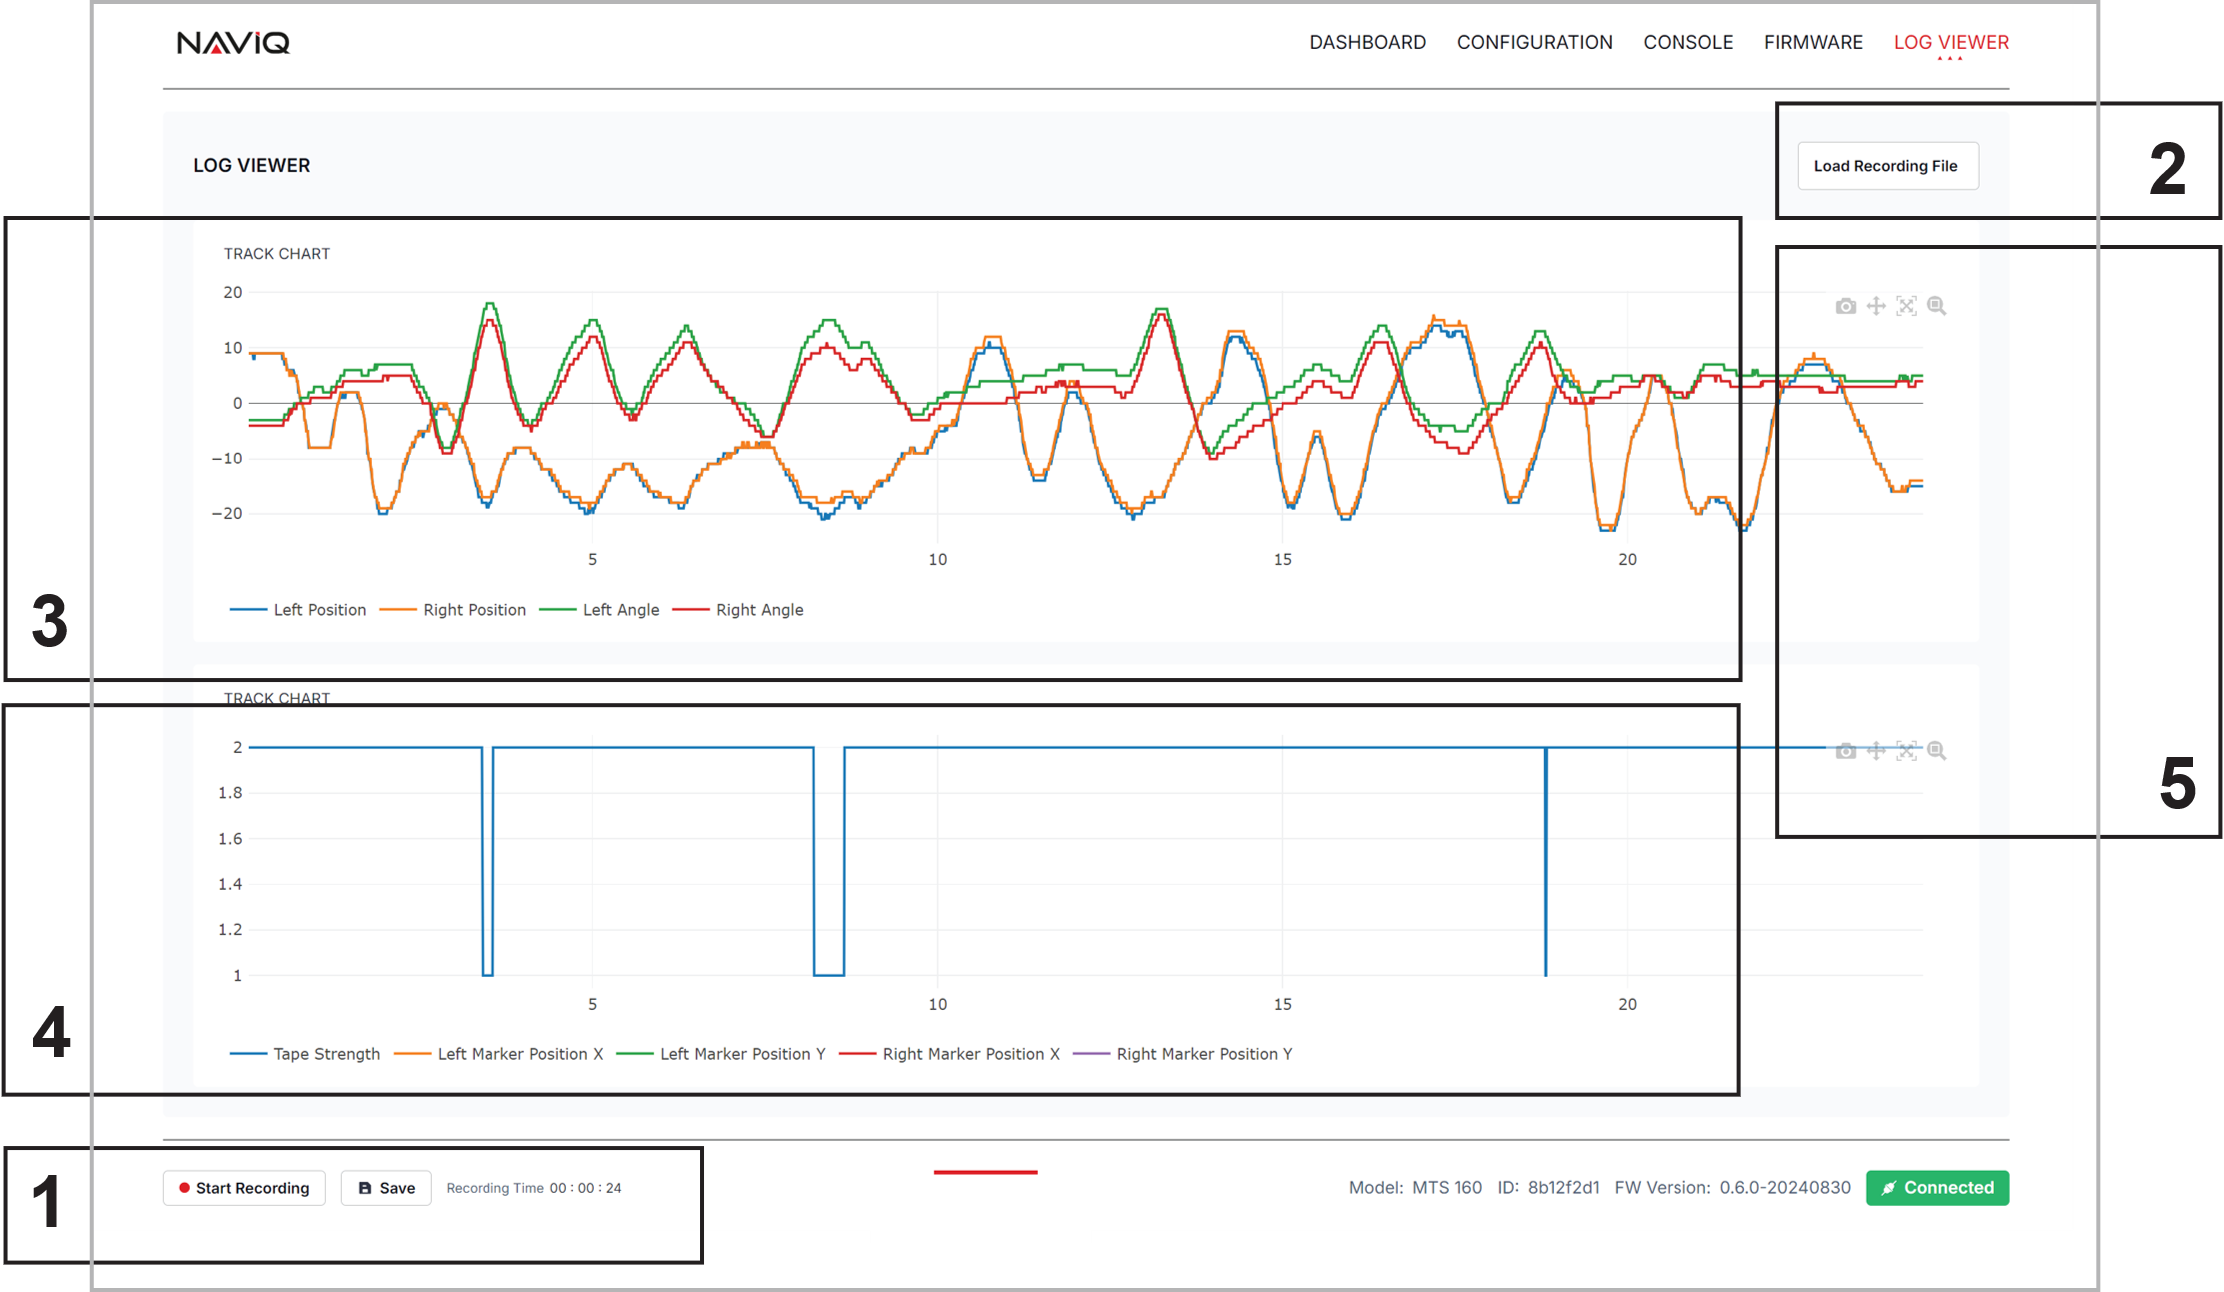
The Naviq Utility includes a data logging function for performance evaluation and troubleshooting. Sensor data can be captured and saved for later analysis. The data logging page includes five components:
- Start/stop logging controls, available from any GUI page through the footer. Saved logs are stored in CSV format for import into spreadsheet tools such as Excel or Google Sheets.
- Log file selection, allowing the most recent log or a previously saved log to be opened
- Track-data graph, used to plot values such as track position and angle. Hovering over a trace shows the numeric value at that point. Each trace can be enabled or disabled independently.
- Detection-state graph, used to plot track-detect and marker states
- Zoom and pan controls for examining areas of interest